• New Report: Growing Number of Minnesotans Can’t Afford Rent

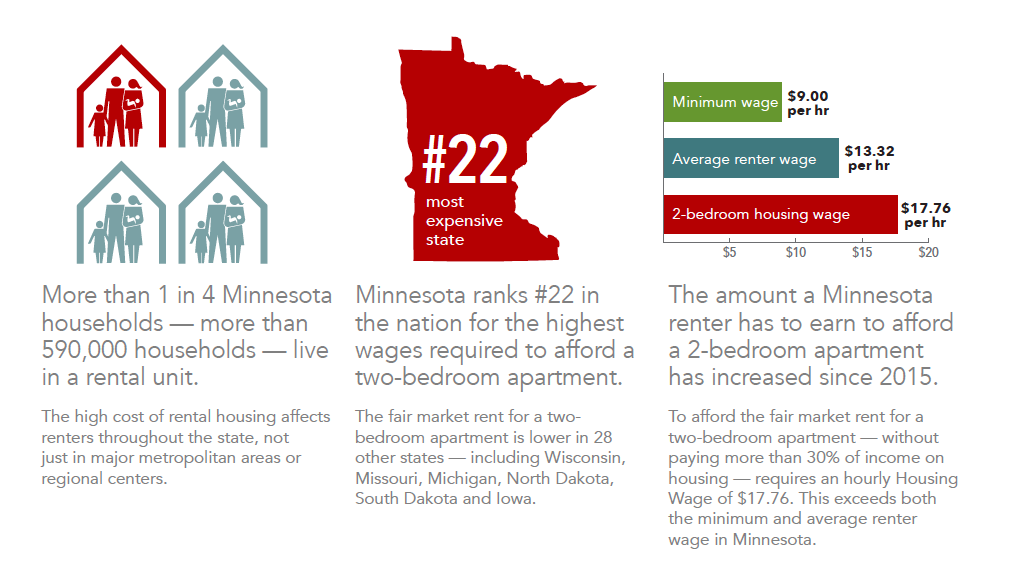
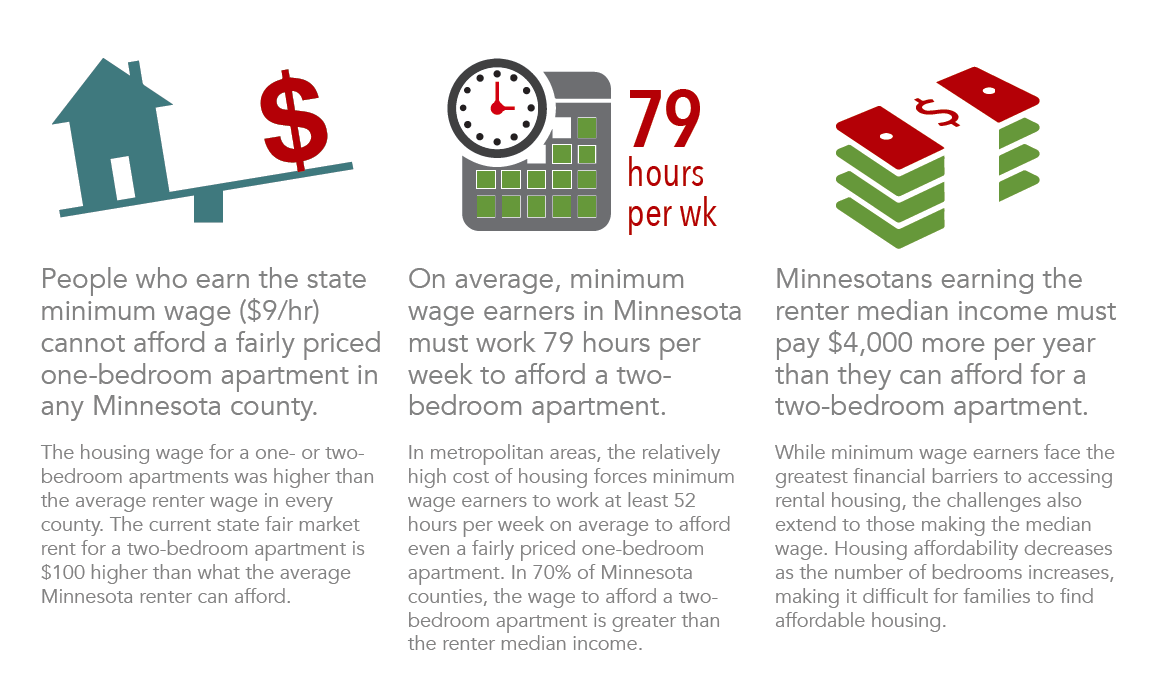
    The Out of Reach report, produced annually by the National Low Income Housing Coalition, spotlights the growing gap between what rental housing costs and how much renters earn. According to analysis by the Minnesota Housing Partnership, Minnesota residents in every corner of the state face significant housing hardships.

    “Minnesota must face the growing crisis of families being unable to cover housing costs,” said Chip Halbach, Executive Director of the Minnesota Housing Partnership. “The price we will pay for our inaction will be seen across the age spectrum, from school children with unstable homes falling behind in their studies to senior citizens forgoing medicine and food to retain their shelter.”

    “The shortage of stable and sustainable rental housing is hurting communities throughout Minnesota — and we need to address this issue now,” said Jeremy Schroeder, Policy Director for the Minnesota Housing Partnership. “The rising costs of rent and the shrinking supply of available units makes growth in greater Minnesota impossible. It’s clear that the most important way we can help struggling working families is to provide more access to affordable, stable housing.”

    Executive Summary

    Click here to read the full report.

  • Watch the gap: district profiles show rising housing costs and declining incomes across MN

    The growing cost of housing in Minnesota hurts low to moderate income families and the communities they call home. From 2000 to 2014, the statewide median income declined among homeowners and renters, but housing costs increased, creating a housing cost burden for 1 in 3 Minnesota households.

    MHP’s 2016 Legislative District Profiles, released last week, document these trends using data specific to each legislative district, economic development regions, and the state. The profiles are created to accommodate busy schedules of housing advocates and local governments by providing a comprehensive yet concise overview of state housing trends, focusing on housing affordability, wages, the rental market, the homeownership market, and homelessness.

    Stable, affordable housing is the foundation for building strong families and communities, making the gap between incomes and housing costs a real threat to the viability of Minnesota. Legislators should consider the impact housing affordability has in their districts as they consider bonding and other bills in the current session.

  • New County Profiles released: Rents up in 82 counties amidst short supply

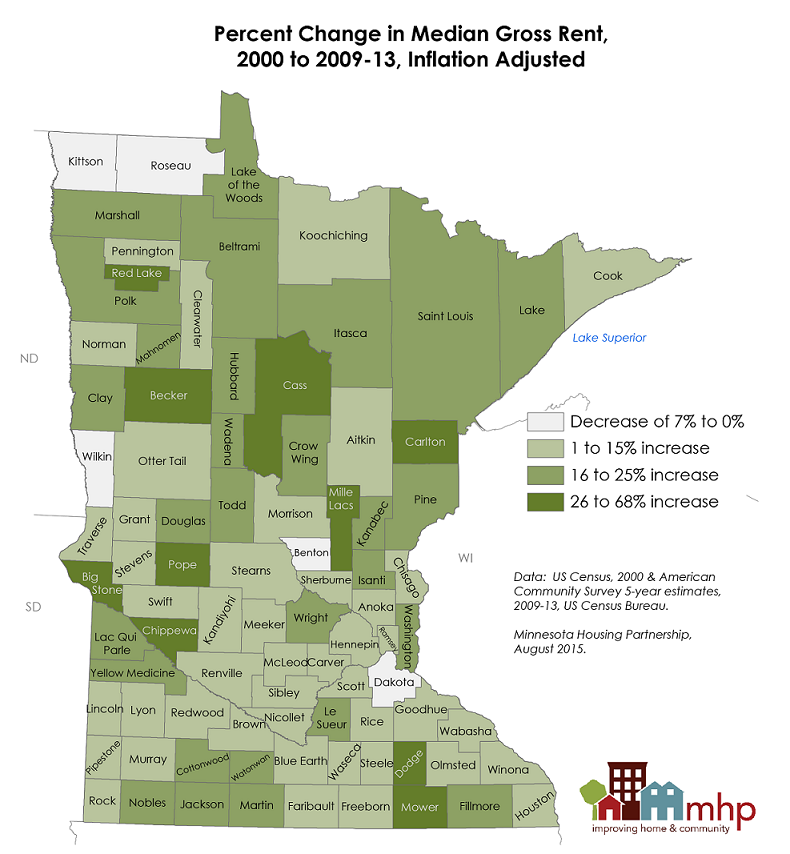
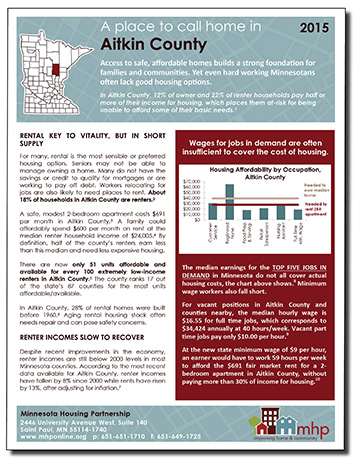
    Our 2015 County Profiles point to trouble for renters all across Minnesota. Rents have risen and affordable rental units are in very short supply for those who need them. This year’s profiles for each of Minnesota’s 87 counties include data not just on housing cost burden, but also on new units permitted for construction, projected needs for seniors, and affordability for top jobs-in-demand. The profiles show there is unmet need in all counties, and that Greater Minnesota counties have seen the sharpest increases in rents since 2000.

    According to the data, rents have increased, even after adjusting for inflation, in 82 of the state’s 87 counties since 2000. Nine counties, all in Greater Minnesota, have seen rents rise 30% or more in this time. Meanwhile, the median renter income has fallen statewide by 17%. 

    Among those impacted by unaffordable housing are children and senior citizens. For example, in 64 of 87 counties, half or more of senior renters are cost burdened by their housing costs currently. Meanwhile the number of seniors statewide is expected to increase nearly 50% by 2030.

    Our counties also lack a sufficient supply of rental housing for extremely low income (ELI) renters. In over a quarter of the state’s counties, for every 100 ELI renters, there are only 30 units or fewer affordable and available to them.

    While construction of more rental housing could help increase rental supply, rental construction has been at or near a standstill in half of the state’s counties. From 2009 to 2014, half of Minnesota’s counties had a total of 20 or fewer new multi-family units permitted. 

    The County Profile findings remind us of the importance of investing in housing at the local, state, and federal levels.

    The County Profiles, produced annually by MHP, take a comprehensive look at data for housing, homelessness, the housing stock, costs to rent and own, and workers’ wages. Check out profiles for Minnesota’s 87 counties and the state as a whole, as well as charts, maps, and summary analysis.

    Join the conversation on Twitter: @followMHP and #MNCoProfiles.

    10 MN Counties with Steepest Rent Increases, 2000 to 2009-13 (inflation adjusted)
    Rank
    County
    % Increase  in Median Rent
    % Change in Median Renter Income
    Median Rent in 2009-13*
    Region of the state
    1
    Big Stone
    + 68%+ 3%$526
    West Central
    2
    Mower
    + 35%– 22%$695
    Southeast
    3
    Pope
    + 34%– 1%$657
    West Central
    4
    Becker
    + 31%+ 5%$647
    West Central
    4
    Dodge
    + 31%– 33%$685
    Southeast
    4
    Chippewa
    + 31%+ 8%$711
    West Central
    7
    Cass
    + 30%– 3%$654
    Central
    7
    Red Lake
    + 30%– 16%$497
    Northwest
    7
    Carlton
    + 30%– 17%$696
    Northeast
    10
    Mille Lacs
    + 27%– 6%$702
    East Central
     
    State of Minnesota
    + 7% – 17%$819 
    *Note: In individual profiles, rents listed are 2015 HUD Fair Market Rents (FMR) for a 2-BR apartment, rather than median rents. Median rents are used to calculate percent increases.
    Source: MHP analysis for 2015 County Profiles using 2000 Census and American Community Survey 5-year estimates 2009-13.

    Questions? Contact Leigh Rosenberg, Research & Communications Director.

  • In the News: Renter Affordability Out of Reach in MN

    This week the annual Out of Reach Report jointly released by the National Low Income Housing Coalition, and in Minnesota MHP, hit the airwaves all over Minnesota, placing the issue of affordability for renters in the spotlight. The report’s release was well-timed, given federal and state budget negotiations for housing programs.

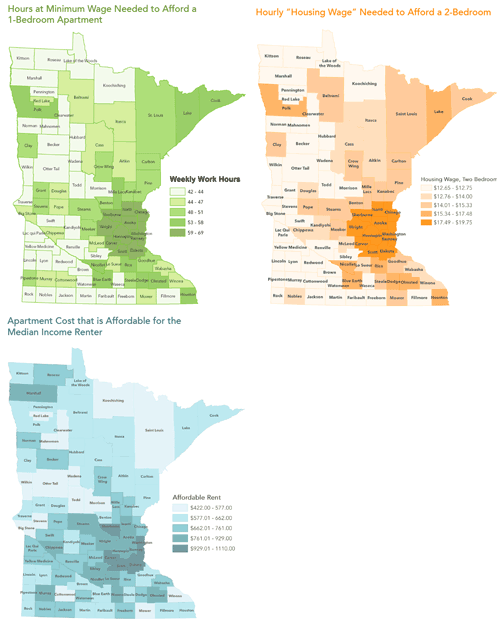
    According to the report released on Monday, in 2011 a Minnesota family must have 2.2 minimum wage earners working full-time – or one person working 87 hours per week at minimum wage – to afford a modest two-bedroom apartment in Minnesota.  Of the 12 states in the Midwest, Minnesota ranks the worst for rental affordability among minimum wage workers.

    In order to afford the rent and utilities for a safe and modest 2-bedroom apartment in the private housing market, a Minnesota worker must earn $15.79 per hour, 40 hours a week, 52 weeks a year.  By contrast, the typical renter in Minnesota earns $11.61 per hour, and a minimum wage earner makes only $7.25 per hour.

    Shortly after MHP’s press release was issued on Monday, the Star Tribune, MPR, WCCO, and the Public News Service (picked up by Clear Channel) produced stories featuring the report and the struggles of renters to afford housing (see MHP in the Media for links to each.)

    Much to the delight of housing advocates, the story hit the television news, too. In the Metro, a KARE 11 story on kare11Wednesday looked at the rental market and the struggles of Minnesotans unable to afford their rent. Catholic Charities housing advocate Katie Tuione of Catholic Charities, and 22-year-old Luvrahsheda Robinson, who earns $600 in income monthly, but also pays $600 in rent, both helped explain the issues.fox_9

    On Thursday, MHP’s executive director Chip Halbach made an appearance on Fox 9 on Thursday for the 11:00 news to discuss some of the reasons for the high rents in Minnesota. He also appealed to the Governor and the Legislature to prioritize decent affordable housing for Minnesotans when considering the state’s budget.

    northlandsnewscenterMeanwhile, in Greater Minnesota, as Minnesota Housing hosted its Regional Housing Dialogue in the northeast, Northland’s NewsCenter did a television story on the need to fund affordable housing programs on the Iron Range, without relying on trust fund money set aside for the Iron Range Resources and Rehabilitation Board (IRRRB), as proposed earlier this session. In this segment, Tony Sertich, Commissioner of the IRRRB and a former legislator, reiterated the need to fund housing.

    “We’ve got to make sure we’ve got available and affordable housing for workers and businesses that are growing on the Range,” Sertich said.

    Out of Reach, which can be found at the National Low Income Housing Coalition’s website at http://www.nlihc.org/oor/oor2011/ includes data on rental housing affordability for every state, county, and metro area in the country.

    Some additional facts about Minnesota rental affordability from Out of Reach 2011

    • The least affordable counties for renters in Minnesota, as determined by the estimated percentage of renters unable to afford a modest two-bedroom apartment, given their earnings, are as follows:

    Winona County (68% unable to afford)
    Aitkin County (67%)
    Mille Lacs County (67%)
    Big Stone County (65%)
    Grant County (63%)
    Faribault County (62%)
    Wadena County (62%)
    Chisago County (62%)

      • The counties with the highest increase in rents since 2000 are outside of the Twin Cities Metro, particularly in southwest Minnesota.  Rents in Martin, Faribault, Cottonwood, Pipestone, Murray, Rock, Watonwan and Jackson Counties have increased by 56% or more since 2000, compared to 32% statewide since 2000.
    • The most expensive area to be a renter continues to be the Twin Cities metro area, where a modest two-bedroom apartment requires a full-time worker to earn $17.77 per hour year-round.

  • 2011 County Profiles Released

    Whether by choice or necessity, more and more people are renting across Minnesota. By 2010, 27% of the state’s households rented their homes, up significantly from mid-decade, according to MHP’s 2011 County Profiles, just released today. What’s more, Hennepin and Ramsey counties are by no means the only counties where renting is important.

    county_profiles_thumb11The County Profiles show that only two of the top ten counties with the highest rental rates in Minnesota are located in the Twin Cities metro.

    Ramsey (39% renter households) and Hennepin (36%) top the list, but are followed closely by Blue Earth (35%), Lyon (34%) and Benton (31%) in Greater Minnesota. (See the full Top Ten list.)

    Over the course of the decade from 2000 to 2010, all ten of the counties with the largest increase in the percentage of renter households were outside of the metro area. Mahnomen, Big Stone, Mower, and Beltrami counties head up this list.

    MHP’s County Profiles pull together housing data for each of Minnesota’s 87 counties—including cost and affordability for owners and renters, changes in home prices, foreclosures, homelessness, and unemployment.*

    Findings include:

    • Rising rents and falling incomes leave Minnesota renters in limbo, especially in a fragile economy. From 2000 to 2011, 80 of 87 Minnesota counties saw increases in rental costs, after adjusting for inflation. Based on the best available data, renter incomes decreased 17% between 1999 and 2009 statewide.
    • In 25 counties, renting a modest two-bedroom apartment requires a higher income than buying a median priced home, assuming a 10% down payment and a 30-year fixed mortgage.
    • Affordability is a critical concern for the state’s expanding rental population. Nearly half of the state’s renters paid more than they should for housing in 2009, by HUD’s affordability standards.
    • The median home sales price ranged from a low of $40,500 in Traverse County in western Minnesota to a high of $247,500 in Carver County in the metro area in 2009-10.
    • From 2006 to 2010, 74 counties (85% of counties) experienced decreases in the median home sales price, after adjusting for inflation. However, over the entire decade through 2010, 60 counties (69%) actually experienced increases in the median price.

    Check out your county profile and the Top Ten lists. Do you see any surprises? Also, we welcome you to share ideas about how you plan to use the County Profiles this coming year.

  • Q4 2010 2×4 Report Released

    MHP’s latest “2 x 4” Report finds family homelessness little improved from height-of-recession 2009 highs, generous inventories of homes still for sale, and employment in housing construction at a 17-year low for the time of year. Meanwhile, Minnesota lawmakers consider deep cuts to state housing and economic development program.

    2x4_thumbnail

    On a brighter note, fewer home owners were delinquent on their mortgage payments.

    Late last week, Minnesota House and Senate lawmakers announced plans to cut funding for housing and economic development programs by about 50%.

    Chip Halbach, MHP’s Executive Director, questioned the wisdom of such cuts with so many workers unemployed.  “State investment in housing is a win-win. It leverages private sector dollars and puts people to work, not to mention ensuring that more Minnesotans can afford a safe place to live,” said Halbach.

    MHP’s “2 x 4” housing indicators report graphically depicts 2 indicators for each of 4 key housing areas: the home ownership market, the rental market, homelessness, and the housing industry. Through quarterly updates, the report provides a concise and timely overview of housing challenges facing Minnesota.

    For fourth quarter of 2010:

    • Vacancies in the Twin Cities rental market again fell sharply to 3.8%, down from 7.3% a year earlier.
    • Family homelessness in Hennepin County was nearly unchanged from height-of-recession 2009 rates for the time of year.
    • Mortage delinquencies fell to 6.5%, compared to about 8% a year earlier.
    • Inventories of homes for sale in the Twin Cities metro were high, despite historically low mortgage rates. About 34% of the homes on the market were foreclosures or short sales.
    • Monthly employment in residential housing construction averaged a mere 8,900 workers, a number for the quarter not seen since1993 for the time of year.

    Be sure to check out the full “2 x 4” Report including graphs, data sources, and analysis.