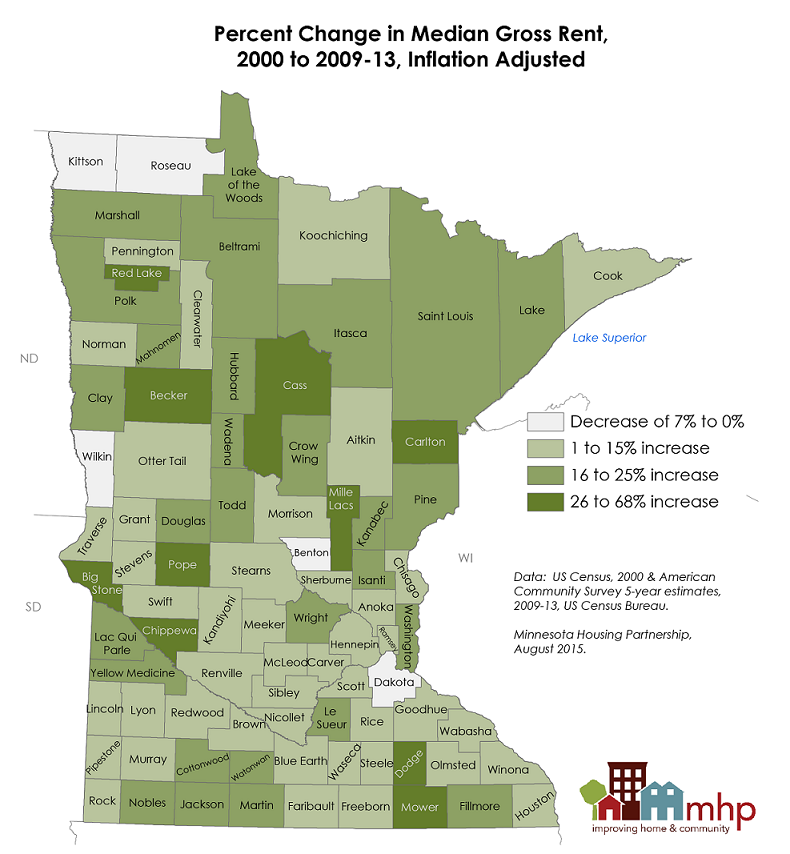
 Our 2015 County Profiles point to trouble for renters all across Minnesota. Rents have risen and affordable rental units are in very short supply for those who need them. This year’s profiles for each of Minnesota’s 87 counties include data not just on housing cost burden, but also on new units permitted for construction, projected needs for seniors, and affordability for top jobs-in-demand. The profiles show there is unmet need in all counties, and that Greater Minnesota counties have seen the sharpest increases in rents since 2000.
According to the data, rents have increased, even after adjusting for inflation, in 82 of the state’s 87 counties since 2000. Nine counties, all in Greater Minnesota, have seen rents rise 30% or more in this time. Meanwhile, the median renter income has fallen statewide by 17%.
Among those impacted by unaffordable housing are children and senior citizens. For example, in 64 of 87 counties, half or more of senior renters are cost burdened by their housing costs currently. Meanwhile the number of seniors statewide is expected to increase nearly 50% by 2030.
 Our counties also lack a sufficient supply of rental housing for extremely low income (ELI) renters. In over a quarter of the state’s counties, for every 100 ELI renters, there are only 30 units or fewer affordable and available to them.
While construction of more rental housing could help increase rental supply, rental construction has been at or near a standstill in half of the state’s counties. From 2009 to 2014, half of Minnesota’s counties had a total of 20 or fewer new multi-family units permitted.
The County Profile findings remind us of the importance of investing in housing at the local, state, and federal levels.
The County Profiles, produced annually by MHP, take a comprehensive look at data for housing, homelessness, the housing stock, costs to rent and own, and workers’ wages. Check out profiles for Minnesota’s 87 counties and the state as a whole, as well as charts, maps, and summary analysis.
Join the conversation on Twitter: @followMHP and #MNCoProfiles.
|
10 MN Counties with Steepest Rent Increases, 2000 to 2009-13 (inflation adjusted)
| |||||
|
Rank
|
County
|
% Increase in Median Rent
| % Change in Median Renter Income |
Median Rent in 2009-13*
|
Region of the state
|
|
1
|
Big Stone
| + 68% | + 3% | $526 |
West Central
|
|
2
|
Mower
| + 35% | – 22% | $695 |
Southeast
|
|
3
|
Pope
| + 34% | – 1% | $657 |
West Central
|
| 4 |
Becker
| + 31% | + 5% | $647 |
West Central
|
| 4 |
Dodge
| + 31% | – 33% | $685 |
Southeast
|
| 4 |
Chippewa
| + 31% | + 8% | $711 |
West Central
|
|
7
|
Cass
| + 30% | – 3% | $654 |
Central
|
| 7 |
Red Lake
| + 30% | – 16% | $497 |
Northwest
|
| 7 |
Carlton
| + 30% | – 17% | $696 |
Northeast
|
| 10 |
Mille Lacs
| + 27% | – 6% | $702 |
East Central
|
|
State of Minnesota
| + 7% | – 17% | $819 | ||
|
*Note: In individual profiles, rents listed are 2015 HUD Fair Market Rents (FMR) for a 2-BR apartment, rather than median rents. Median rents are used to calculate percent increases.
| |||||
|
Source: MHP analysis for 2015 County Profiles using 2000 Census and American Community Survey 5-year estimates 2009-13.
|
Questions? Contact Leigh Rosenberg, Research & Communications Director.