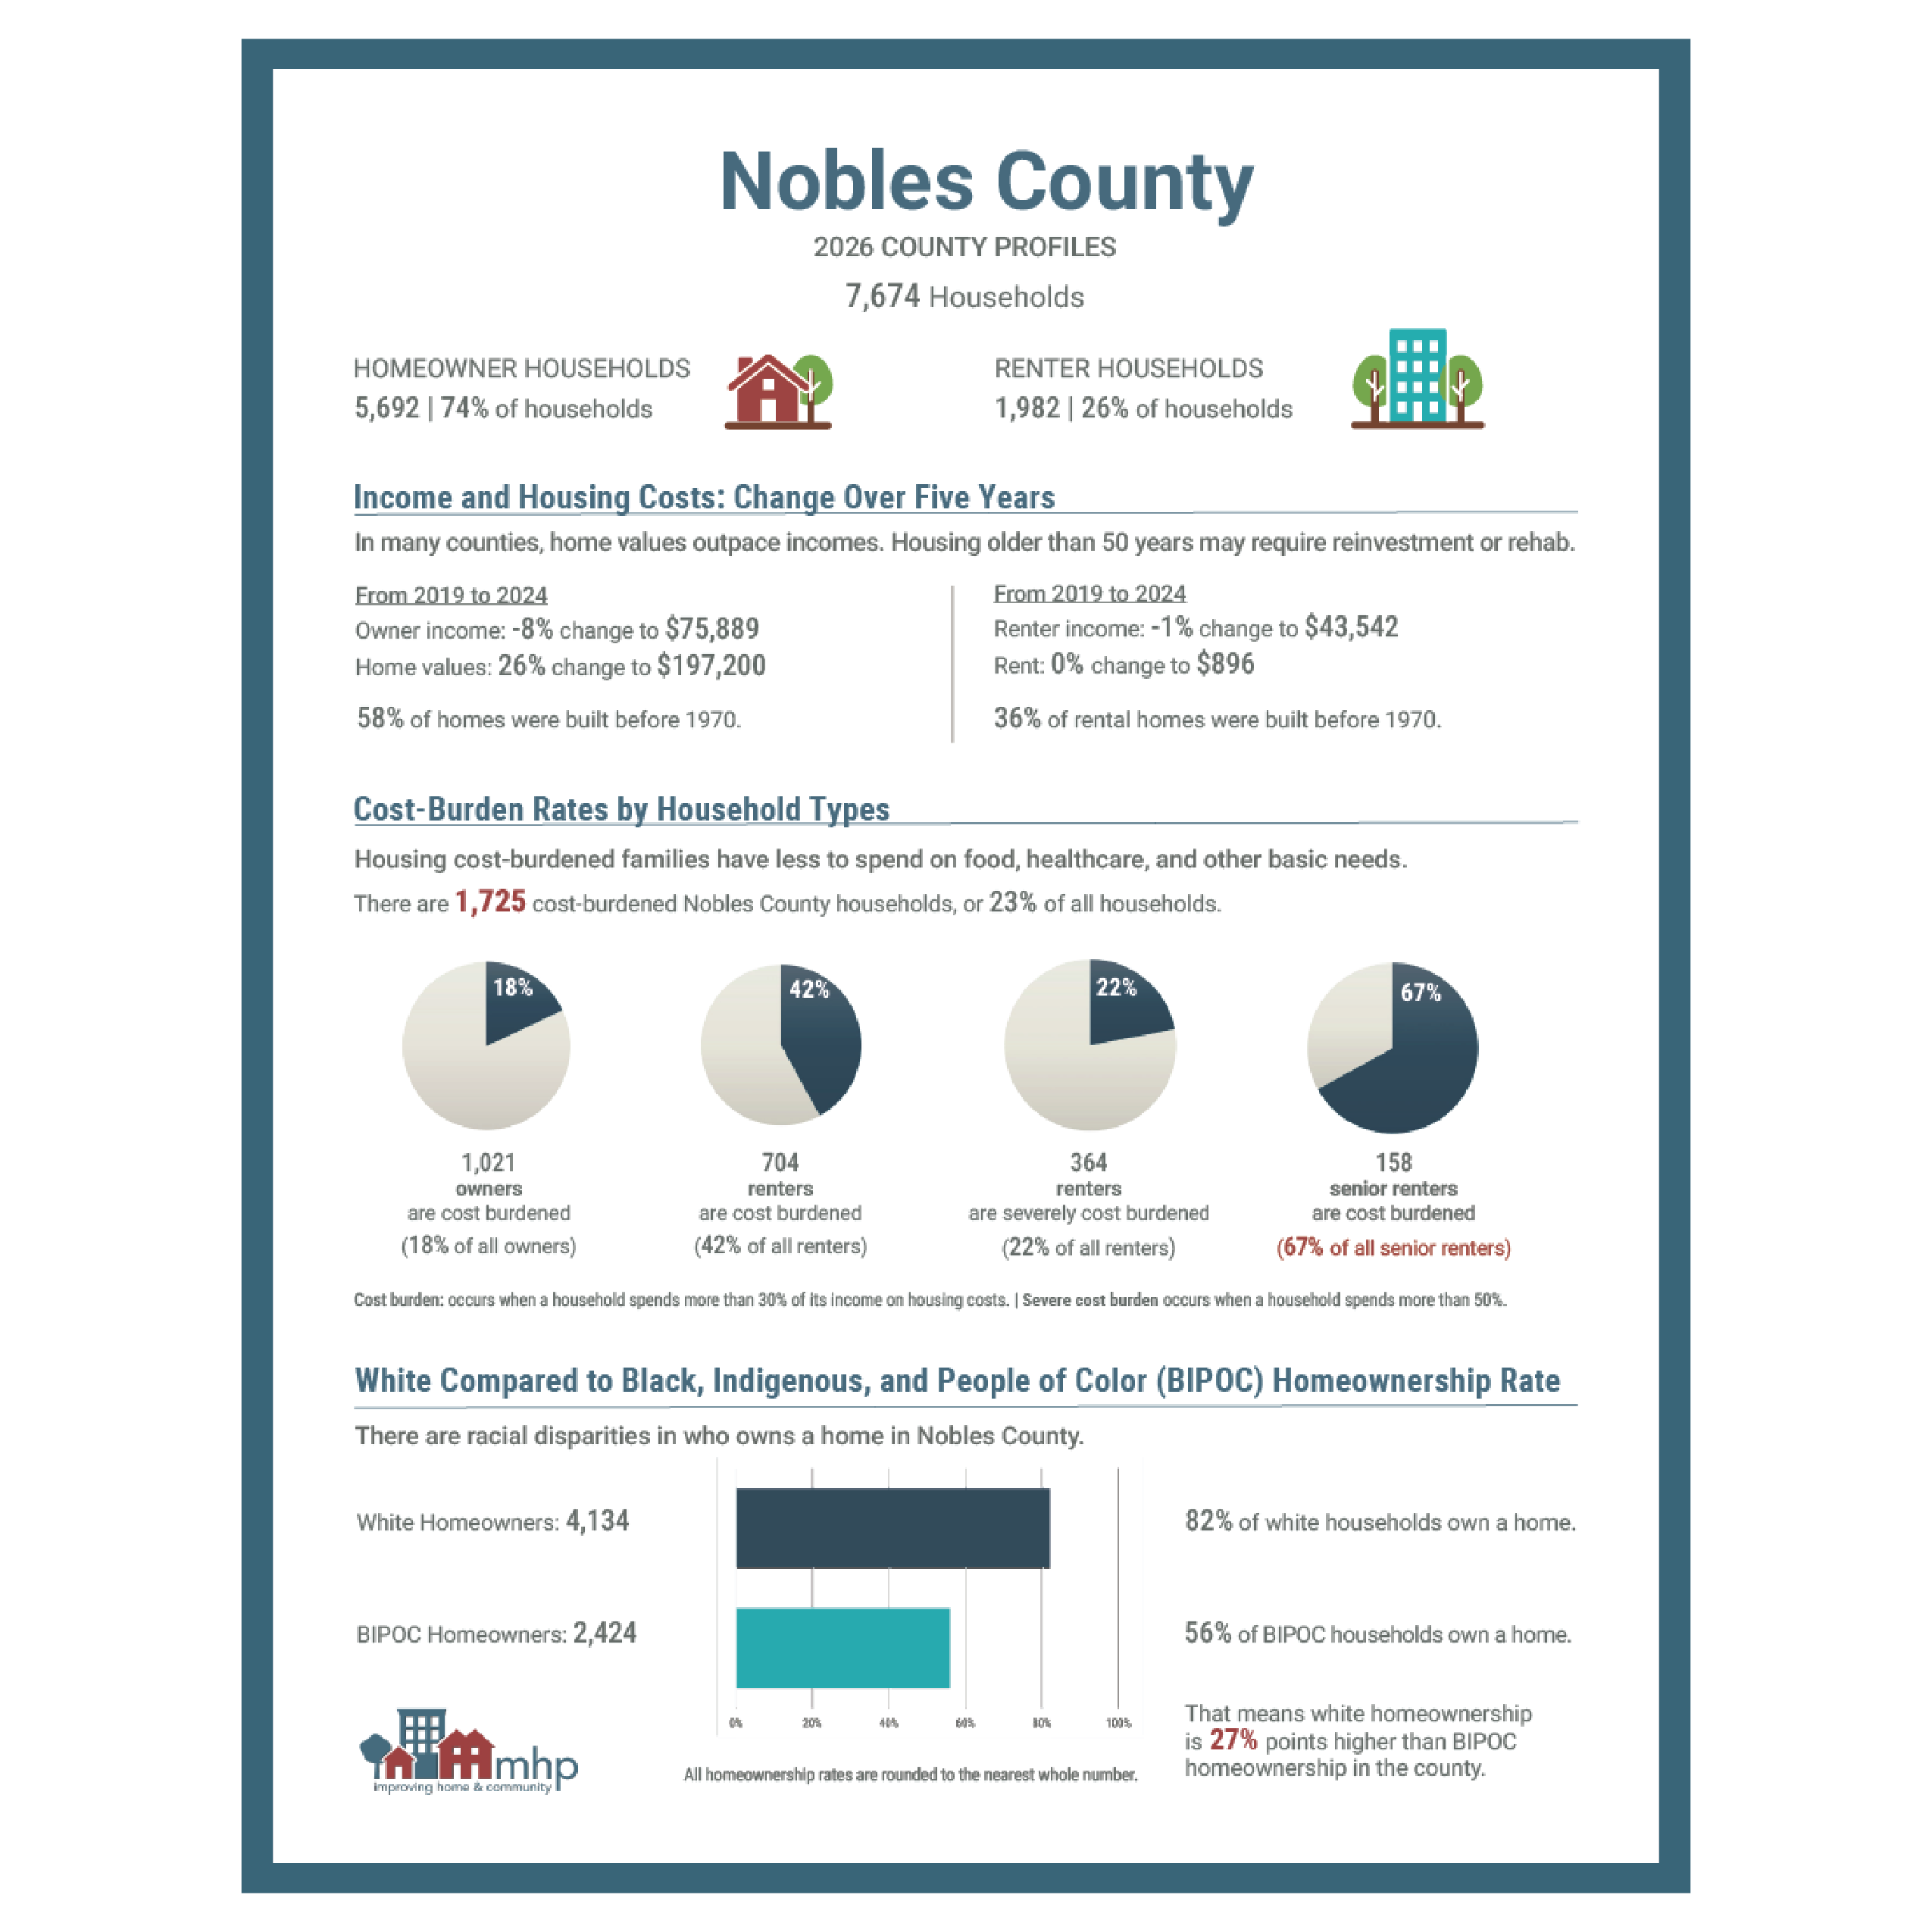
• 2026 County Profiles

    2026 County Profiles

    MHP Research Highlights Housing Costs, Homeownership Gaps, and Rental Shortages in All 87 Counties

    A stable home is the foundation for strong communities, economic opportunity, and a thriving Minnesota. Yet new research from MHP finds that people in every corner of the state are increasingly struggling to find a home they can afford.

    MHP’s County Profiles report is one of the organization’s most widely used research tools. Updated every two years, the profiles examine housing conditions in all 87 Minnesota counties, providing local data on housing costs, renter and homeowner cost burden, homeownership disparities, the wages needed to afford housing, and the shortage of homes affordable and available to renters with extremely low incomes.

    Key Findings from the 2026 County Profiles

    • Every county in Minnesota has too few homes that are affordable and available to renters with extremely low income.* In 79% of counties, the shortage exceeds 100 homes; in nearly one-third of counties (32%), it exceeds 500 homes. 
    • Home values rose faster than homeowner incomes from 2023 to 2024. Home values increased in every county in Minnesota this year, while homeowner incomes increased in only 65% of counties.  
    • At least one in four renters are cost burdened— paying more than they can afford for housing—in every county in the state. In 20 counties, more than half of renters are burdened. 
    • Senior renters face especially high housing costs. In every county, at least 30% of senior renter households are cost burdened, and in 78% of counties, more than half are cost burdened.
    • White, non-Hispanic households have high homeownership rates across Minnesota, ranging from 65% to 89%. Yet large disparities remain: in Minnesota’s most populous counties,** homeownership rates for Black, Indigenous, and other households of color ranges from 42% to 74%. 

    *Extremely low-income indicates people are those earning less than $33,000 a year. Because higher-income households often occupy homes affordable to lower-income renters, the shortage of affordable and available homes for extremely low-income renters can exceed the state’s overall housing shortfall.
    **Counties with over 100,000 households.

    “The data in these profiles tell a remarkably consistent story across Minnesota’s 87 counties,” said Gabriela Norton, Director of Research at MHP. “In every county, renters with extremely low incomes face a shortage of homes that are affordable and available to them, and in every county, at least one in four renters is cost burdened. We also see that older adults and households of color are more likely to face barriers to stable housing and homeownership. By making these trends visible at the local level, we hope these profiles can help communities and policymakers better understand the challenges they face and identify solutions that can make a difference.”

    “A stable home is the foundation for opportunity and strong communities. These profiles show that communities across Minnesota are facing a common challenge: housing costs are rising and there are too few homes people can afford. The good news is that communities across Minnesota are already showing us what is working in their communities when we invest in more homes and more housing choices.” said Anne Mavity, Executive Director of MHP.

    The County Profiles are intended to help local leaders, advocates, policymakers, and community members better understand housing conditions in their communities and support local conversations about solutions.

    Links to Profiles by County


    • Cost burden and homeownership: U.S. Census Bureau, American Community Survey (ACS), 2024 5-year estimates.
    • ELI renters and affordable homes: U.S. Department of Housing and Urban Development (HUD), ACS 5-year Comprehensive Housing Affordability Strategy (CHAS) county estimates, 2025 release based on 2018-2022 data 
    • In-demand jobs: Minnesota Department of Employment and Economic Development (MN DEED), Occupations in Demand, 2025
    https://mhp.sdho.dev/2023-county-profiles
    https://mhp.sdho.dev/2021-county-profiles
  • 2026 State Profile

    2026 State Profile

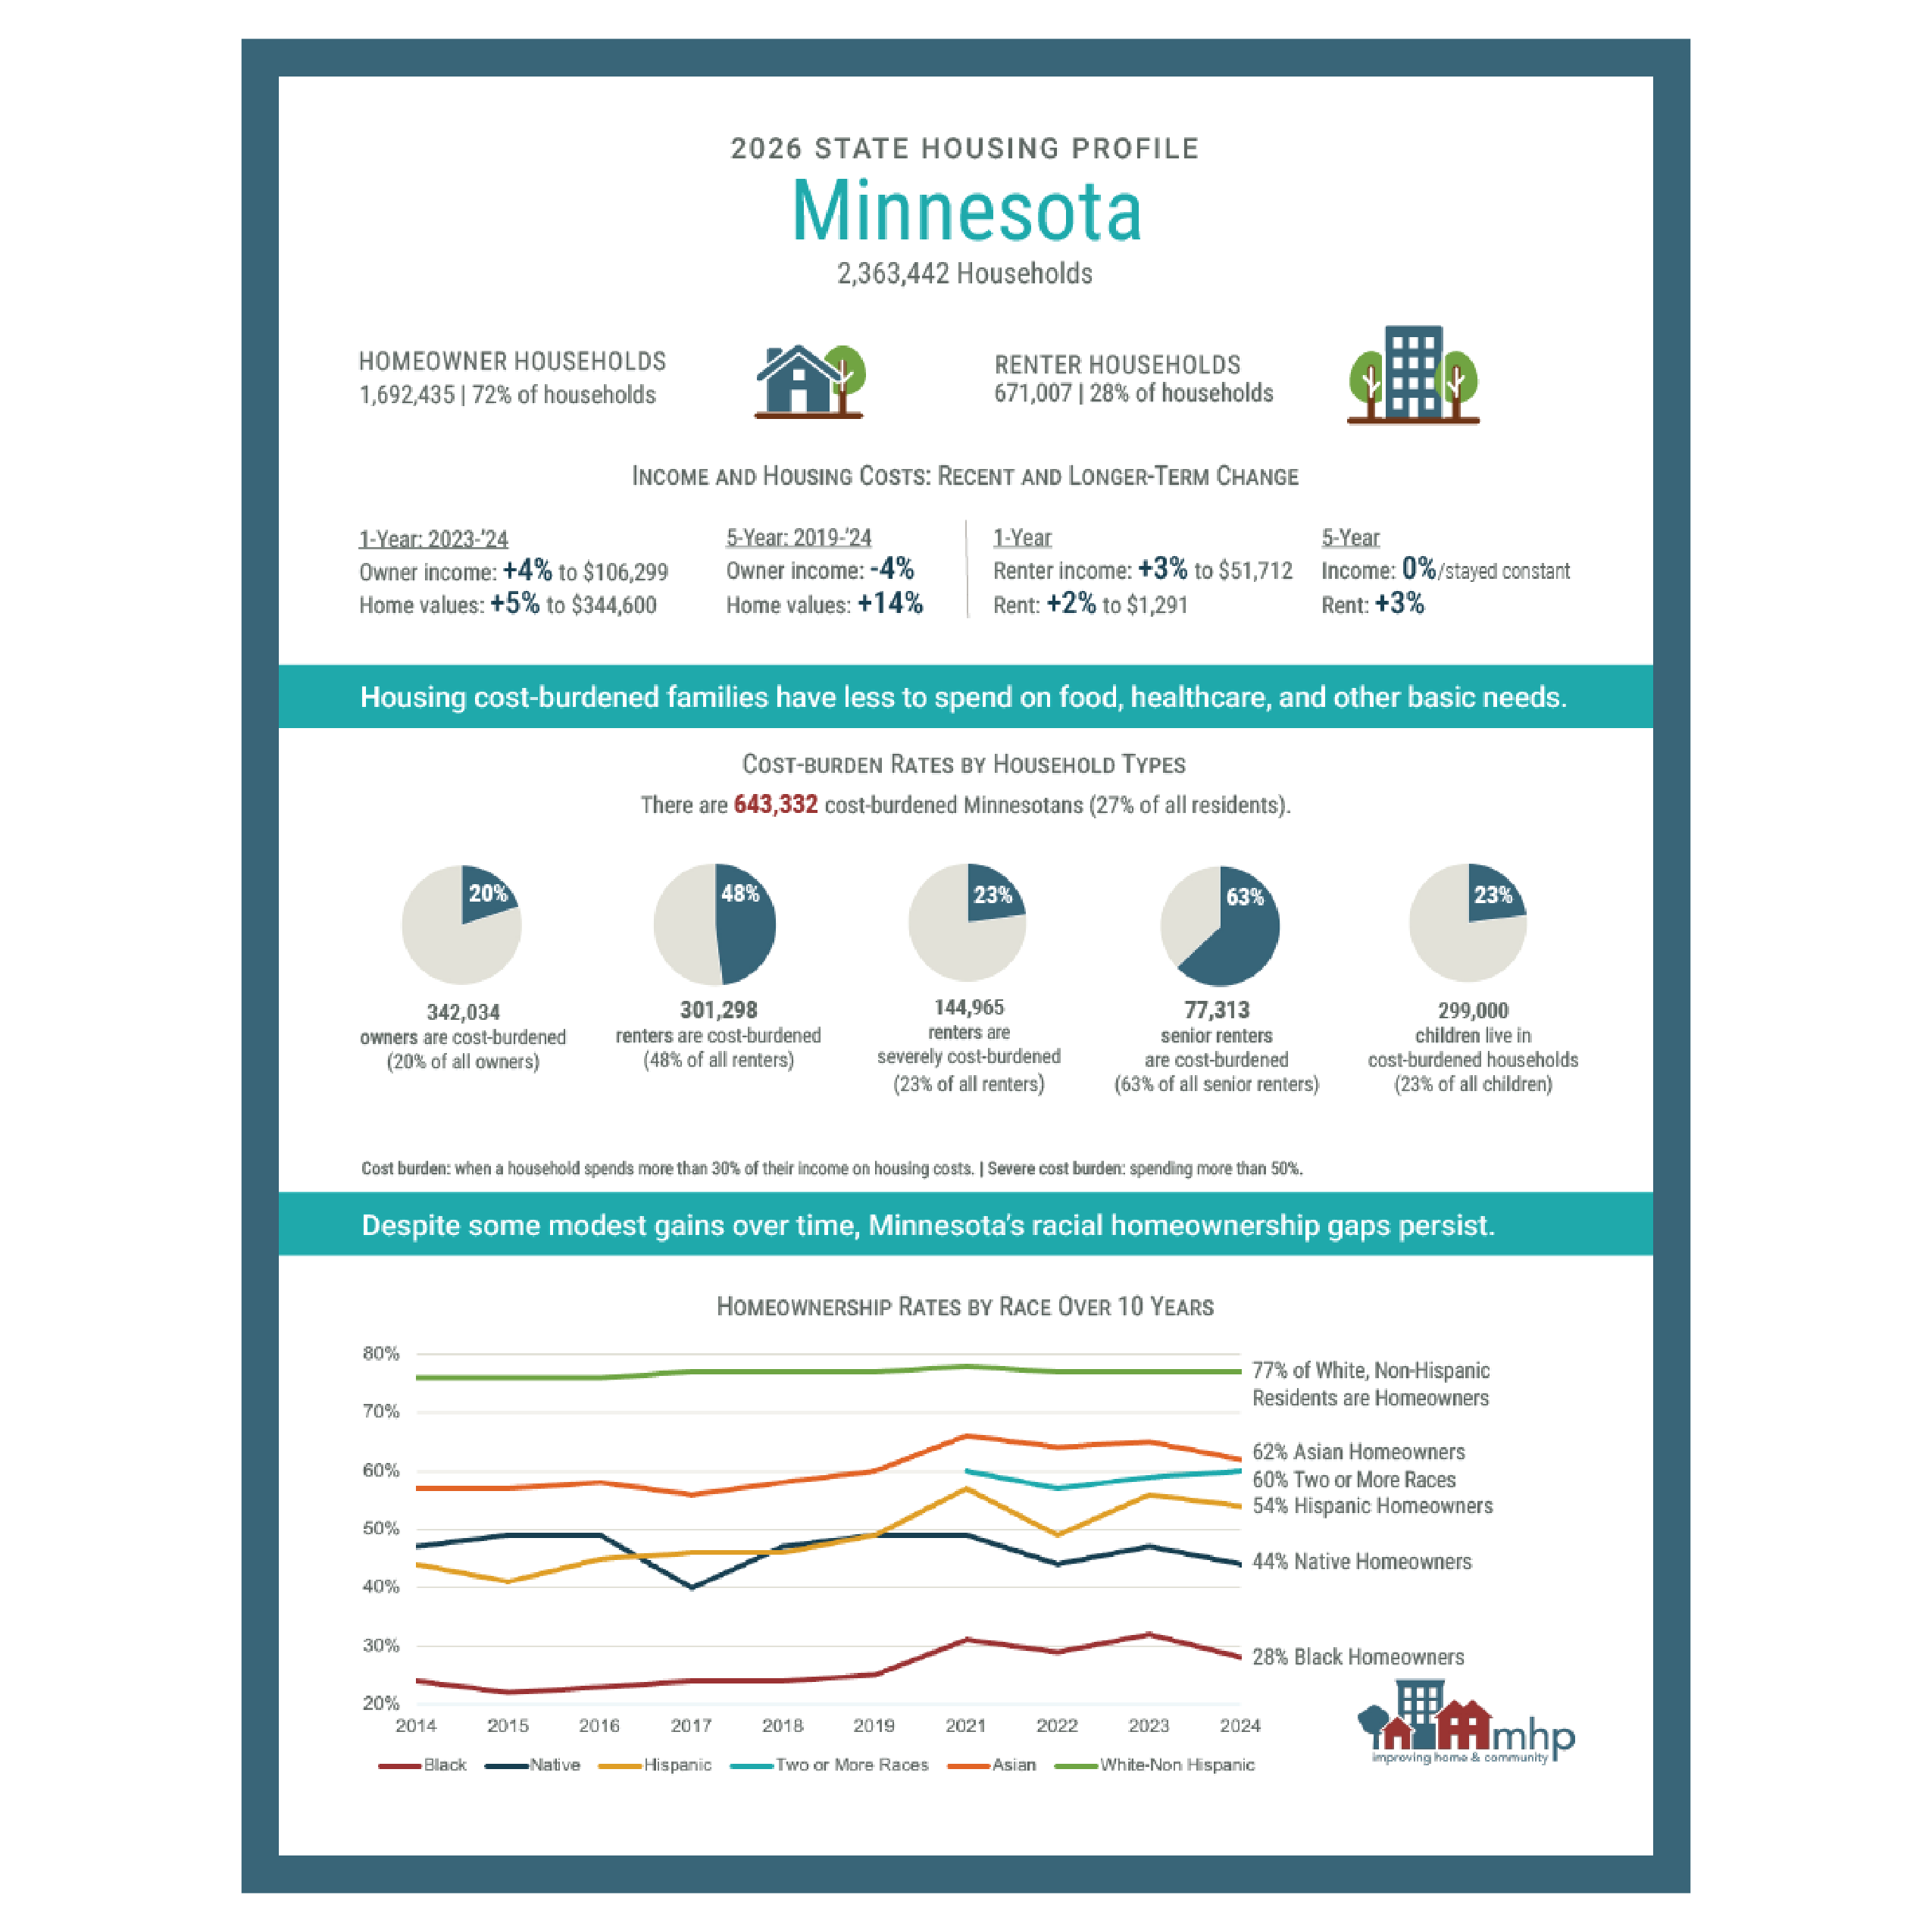
    The 2026 State Housing Profile shows that Minnesota’s housing shortage continues to strain renters, workers, and first-time homebuyers, with the greatest impacts falling on households with the lowest incomes and on communities of color.

    “These findings make clear that Minnesota’s housing shortage isn’t an abstract problem — it’s showing up in people’s day-to-day lives,” said Anne Mavity, Executive Director of MHP. “When people working in our most in-demand jobs can’t afford to live near where they work, and when renters are forced to choose between housing and basic needs, that’s a sign our housing system is out of balance. This report points to where the gaps are — and why action matters.”

    Key Findings from the 2026 State Housing Profile

    • Nearly half of Minnesota renter households are cost burdened, leaving families less money for food, health care, and other basic needs. The strain is even greater for older adults, with 63% of senior renters cost burdened.
    • Minnesota’s housing shortfall has the greatest impact on renters with the lowest incomes. For extremely low-income renters alone, there is a shortage of more than 101,000 affordable and available homes.*
    • The median age of a first-time homebuyer in Minnesota has risen to a historic high of 40 years, reflecting growing barriers to entering the housing market.
    • Home values are rising faster than homeowners’ incomes. None of Minnesota’s top five in-demand jobs pay enough for workers to afford homeownership, and, of the five, only registered nurses earn enough to afford quality rental housing.
    • Minnesota ranks 45th in the nation with one of the worst homeownership gaps between white (non-Hispanic) households and households of color. Homeownership rates declined in the past year for Black, Native American, Hispanic, and Asian households.

    Previous State Profile: 2025

    *Extremely low-income indicates people are those earning less than $33,000 a year. Because higher-income households often occupy homes affordable to lower-income renters, the shortage of affordable and available homes for extremely low-income renters can exceed the state’s overall housing shortfall.

  • 2025 Congressional District Profiles

    2025 Congressional District Profiles

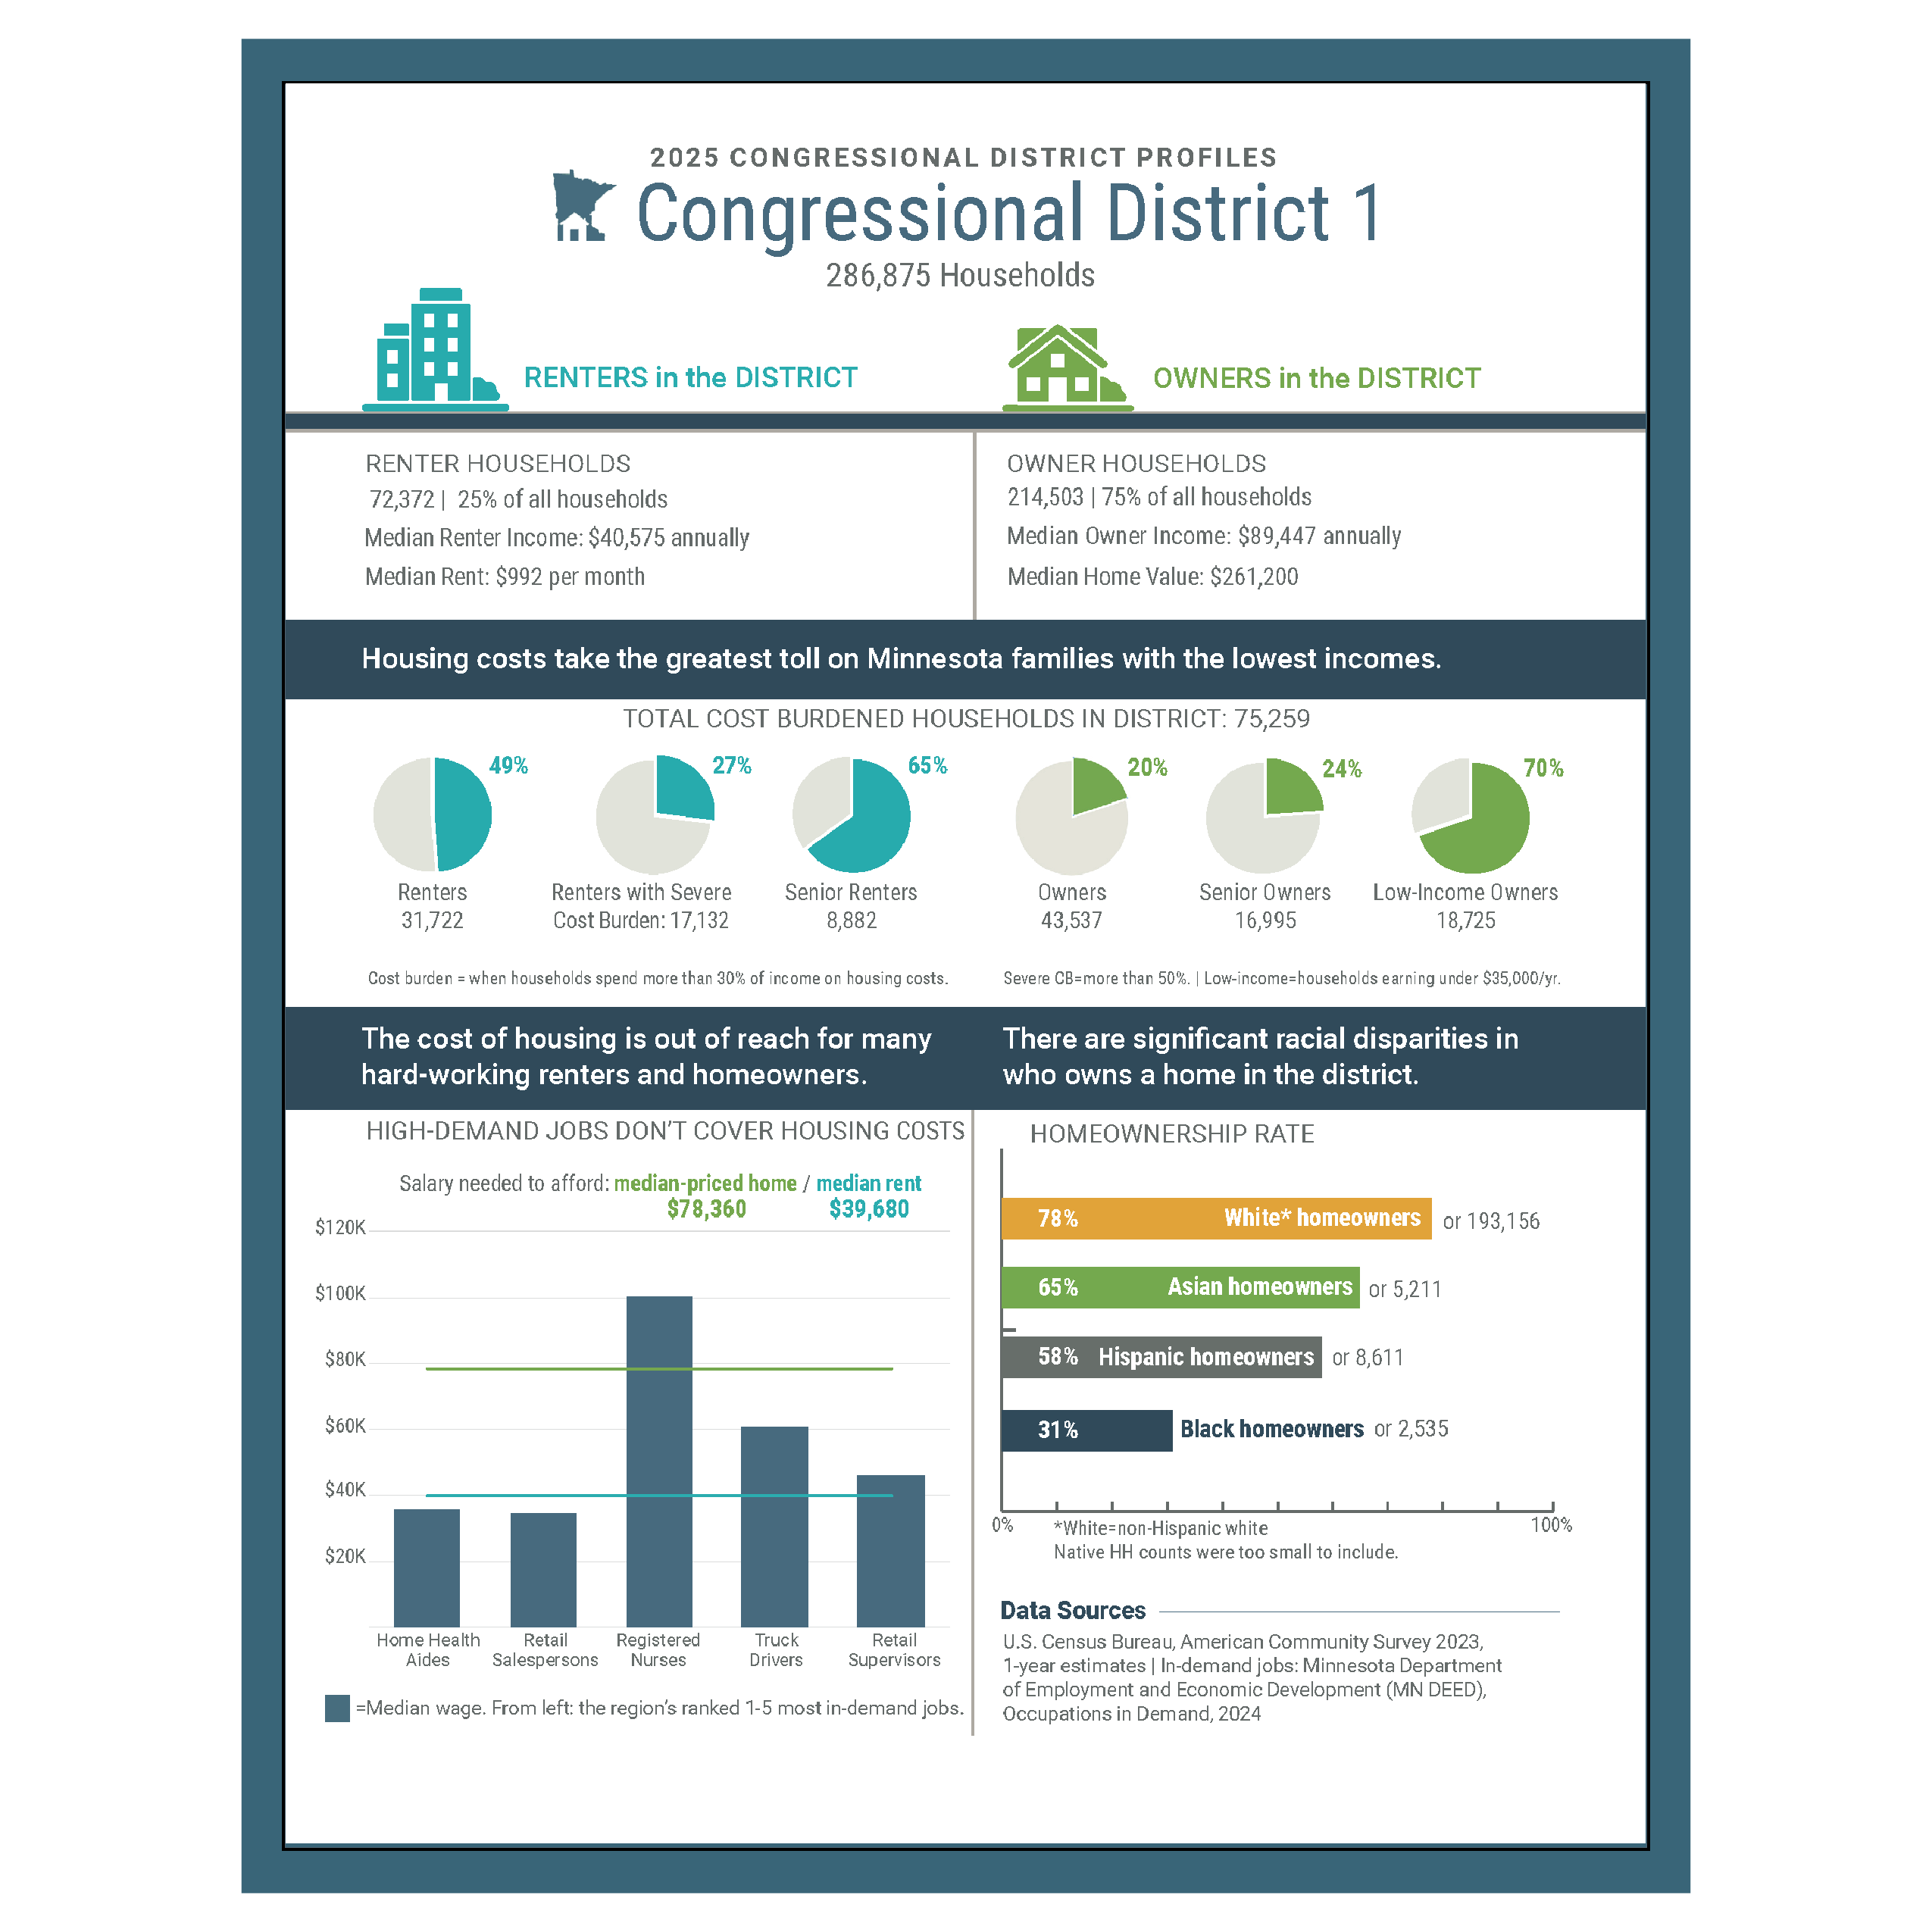
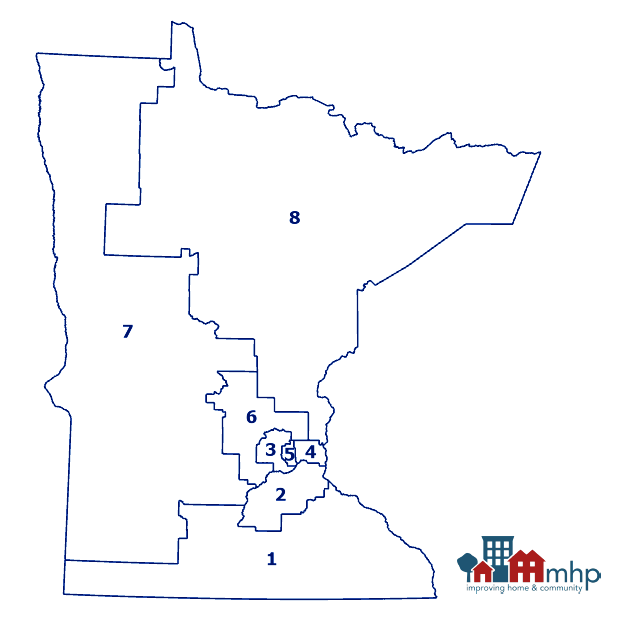
    MHP’s Congressional District Profiles break down housing affordability, homeownership gaps, and cost burdens across Minnesota’s eight congressional districts. The Congressional District Profiles are part of MHP’s series of reports on housing data and affordability metrics, including the 2025 State Housing Profile and Legislative District Profiles. The report provides a rare, congressional district-level view of the housing challenges Minnesotans face — underscoring that no region is untouched by rising housing costs and persistent disparities in homeownership.

    “This report paints a clear picture of a statewide reality: far too many Minnesotans—whether renting or owning—are struggling with housing costs. What’s striking is how these challenges show up in every congressional district, even as local conditions differ. In-demand jobs in many communities don’t pay enough to afford a home, and the result is a growing burden on the very people we rely on most. We hope this district-level data helps leaders craft solutions that meet the unique needs of their constituents.” -Anne Mavity, MHP Executive Director

    In all districts, the salary needed to afford a median-value home far outpaces what homeowners actually earn, with Districts 5, 7, and 1 (respectively) containing the largest gaps. And, in three districts, rent far outpaces what the median earning renter can afford (Districts 6, 7 and 1, respectively).

    Key findings include:

    • District 1 has the highest percentage of severely cost-burdened renter households in the state, with 27% spending more than half their income on rent.
    • District 2 stands out as the only district where the typical renter earns more than needed to afford the median rent—by about $2,500 annually.
    • District 3 reports the highest median rent and home value (and highest income among renters and owners in the state), and over half of renter households (51%) are cost burdened.
    • District 4 data shows most housing indicators falling near the statewide averages, including that high demand jobs, with the singular exception of registered nurses, don’t cover the cost of rent or a median priced home.
    • District 5 has the highest share of renters (47%) and the lowest rate of cost-burdened renter households. This district has the highest percentage of cost-burdened senior homeowners (33%).
    • District 6 reveals deep struggles for seniors, with 73% of older renter households cost-burdened—the highest rate statewide. This district also has the largest gap between median renter income and the salary needed to afford median rent—renter households would need to earn an additional $3,355 annually to afford median rent. It also has the smallest racial homeownership gap.
    • District 7 homeowners and renters do not earn enough to afford a median-value home or median-rent apartment, with the gap between median income and housing costs the second largest in the state for both homeowners and renters. The district has the largest racial homeownership gap, and the lowest rate of cost burden among seniors.
    • District 8 faces the highest owner cost burden, with 22% of homeowners spending more than 30% of their income on housing costs; additionally, District 8 has the highest proportion of homeowners who have “low income,” with 15% of homeowners earning under $35,000 annually.

    Across all districts, the data reveals a common thread: the cost of housing is outpacing incomes, particularly for renters and seniors, and long-standing racial inequities in homeownership persist.

    Previoius Profiles: 2021 Congressional District Profiles

  • State of the State’s Housing 2024

    State of the State’s Housing 2024

    Read the report

    Whether we’re digging each other out of the snow or sharing a meal, in Minnesota, we look out for each other. Today we face many challenges, but stable housing should not be something you have to think about—it should be something that families can count on every day. Yet, many Minnesotans know all too well the struggle to find a place to live, make rent, or cover our mortgage. MHP’s statewide research shows over a quarter of Minnesota families, including half of all renting families, pay more than they can afford for housing—and that number, along with the problem, is growing.

    MHP’s 2024 State of the State’s Housing report combines the State Housing Profile with Key Findings and Trends (released in March 2024) with a detailed analysis of housing trends across all seven Minnesota regions (Central, Northland, Northwest, Southern, Southwest, Twin Cities, and West Central). Each regional profile includes localized data on factors such as cost burden, the salaries needed to afford housing, eviction rates, and homelessness—revealing the unique challenges each region faces. Featured alongside the profiles are stories of organizations and individuals working tirelessly to bring about positive change in their area.

    Since 2017, MHP’s State of the State’s Housing report has provided critical statewide housing data, serving as an important baseline for understanding the housing climate and its impact on Minnesotans. These reports are widely used by media and housing advocates to paint a comprehensive picture of Minnesota’s housing challenges. By equipping advocates and lawmakers with data-driven insights, we can collectively address solutions so all Minnesotans have access to stable housing they can afford.

    Ensuring everyone has a safe place to lay their heads at night—whether our loved ones or strangers—will make our neighborhoods more vibrant, our communities safer, and our state stronger.